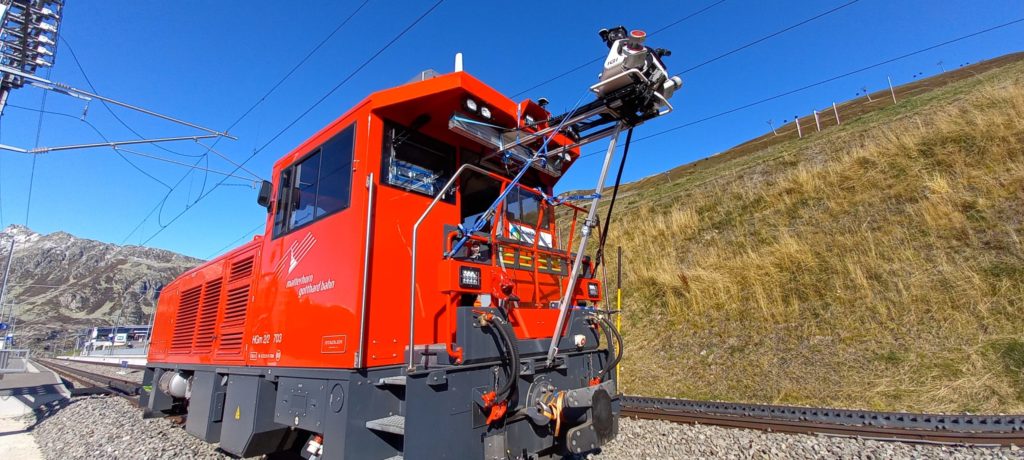
The entire network of the Matterhorn Gotthard Bahn (MG Bahn), from Zermatt to Disentis, as well as the section between Andermatt and Göschenen, which is about 150km long, was surveyed in October 2021 using our Mobile Laser Scanning system (MLS). This system provides a very high density point cloud coupled with georeferenced panoramic images of the track and its surroundings.
The result of the survey is provided to the client as a web publication and a 3D viewer. These tools allow the client to take measurements at any location via a web browser and to analyse the data thoroughly.
In order to efficiently detect conflicts between free spaces and objects along the line, we calculate different types of templates for the entire railway network on behalf of MG Bahn.
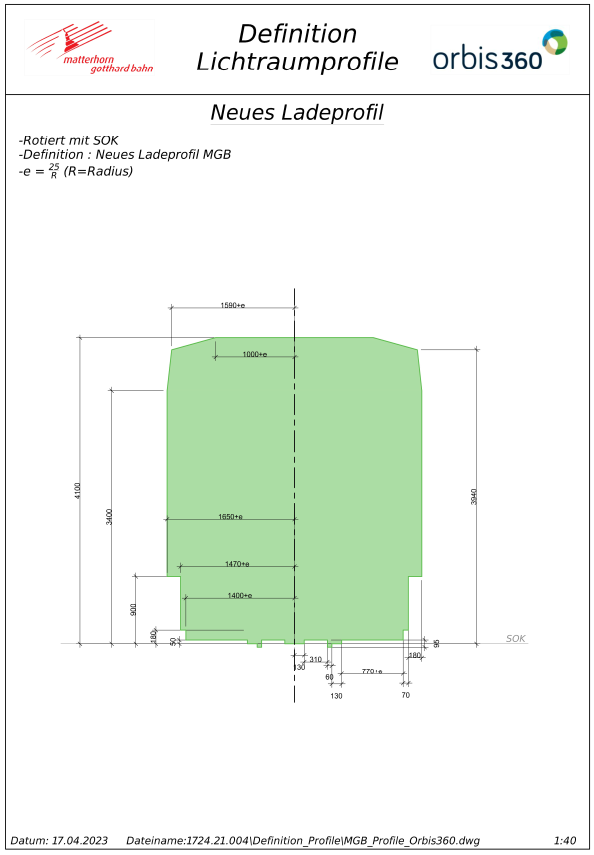
Definition of the different types of free space templates
Clearance templates are 3D profiles that correspond to precise definitions provided by MG Bahn. The exact dimensions of the templates depend not only on the actual position of the track or the position of the catenary but also on various parameters such as the radius of curvature, the tilt at this position or the coordinates of the nearest rail points.
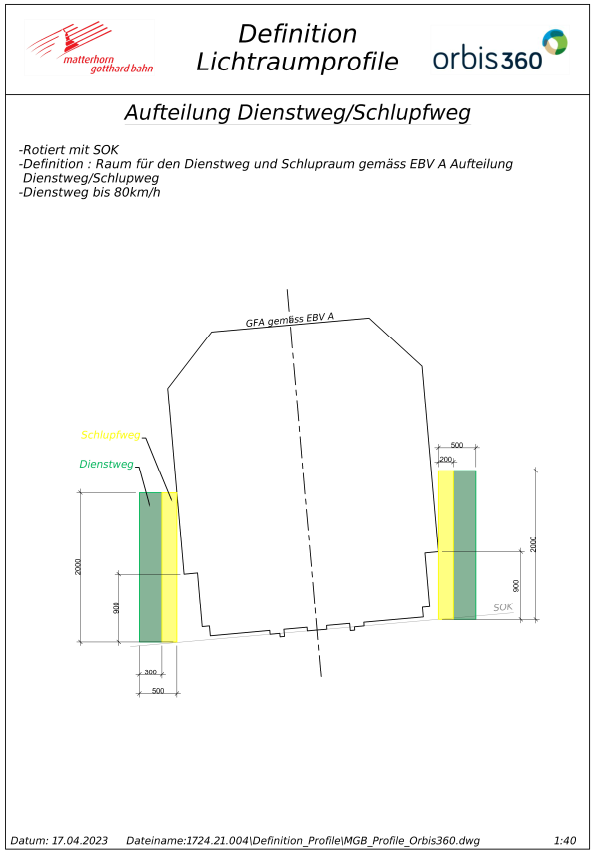
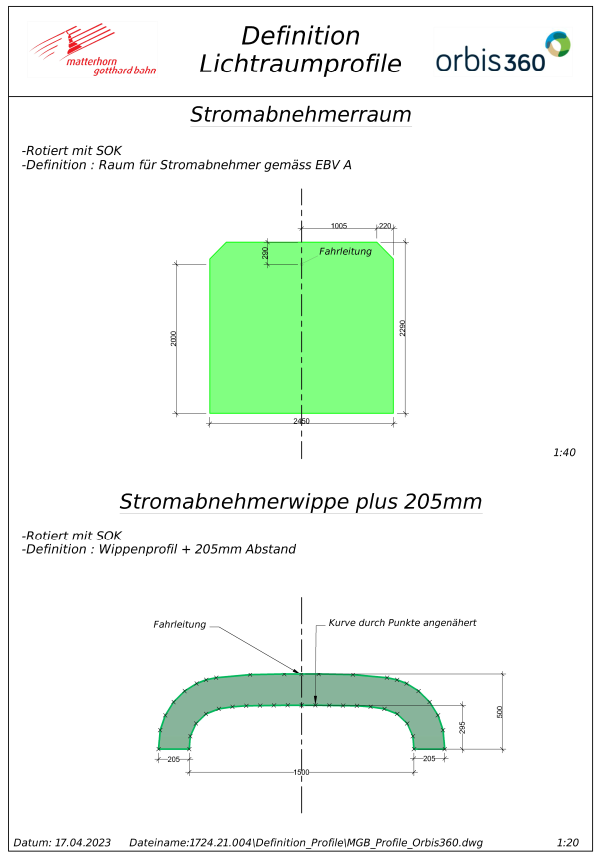
All these attributes are calculated directly from the point cloud, the scans and the track axis parameters. The gauge profiles can for example concern the space that must remain free around catenaries to avoid arcing or the areas where vehicles windows can be opened. One can also define the evacuation areas along the train that must be free and accessible along the line.
These definitions can be made for different types of vehicles and on any section of the network. The definitions thus depend on several location-related parameters and are therefore subject to complex calculations in order to define them along the entire network. Three examples of gauge definitions are shown below.
Computation of the different profiles on the LiDAR survey
By calculating the free gauges spaces at each meter of the MG Bahn network, we compute the points of the LiDAR survey that are present in these 3D profiles. Special analysis tools have been developed to guarantee the efficiency of the profile computation (about 150’000 profiles per gauge are calculated from the 6.7 billion survey points).
Then each profile has the points in the network that “collide” with it. These points are assembled into homogeneous groups using classification methods provided by the TerraSolid point cloud processing suite. 2D zones are then created for each group.
These “clusters”, as point cloud groups and 2D polygons, are provided to the customer.
Grengiols Tunnel – Cluster of different types of gauges
Data publishing and visualization
The use of our data and results for this project is mainly done through a web platform that was also entirely developed in-house by Orbis360 according to the specific requirements of the client MG Bahn.
Rather than describing the various features of this viewer, we present it below through a short video.